Exercise 1. Hypertension is denoted by H and myocardial infarction by I. Identify which set expression correctly…
Probabilitat, probabilitat condicionada i teorema de Bayes
Exercise 1. Event notation for hypertension and infarction
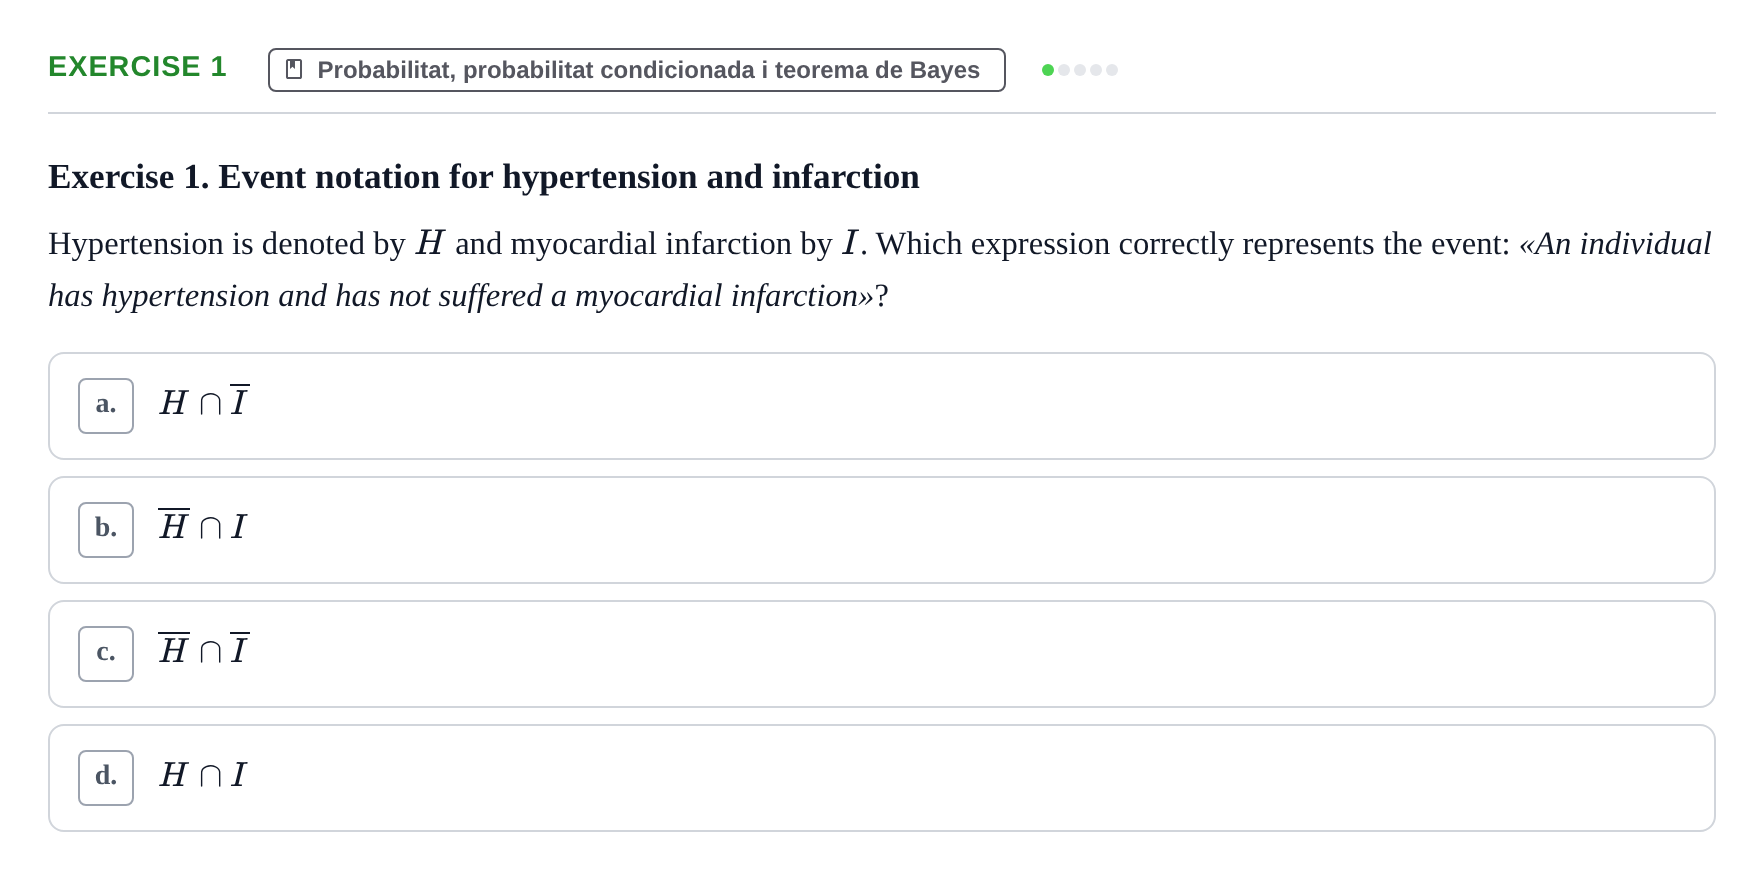
Hypertension is denoted by and myocardial infarction by . Which expression correctly represents the event: «An individual has hypertension and has not suffered a myocardial infarction» ?
.
Exercise 2. Let F represent having a family history of MI, H represent hypertension, and I (or MI) represent having…
Probabilitat, probabilitat condicionada i teorema de Bayes
Exercise 2. Event notation with family history
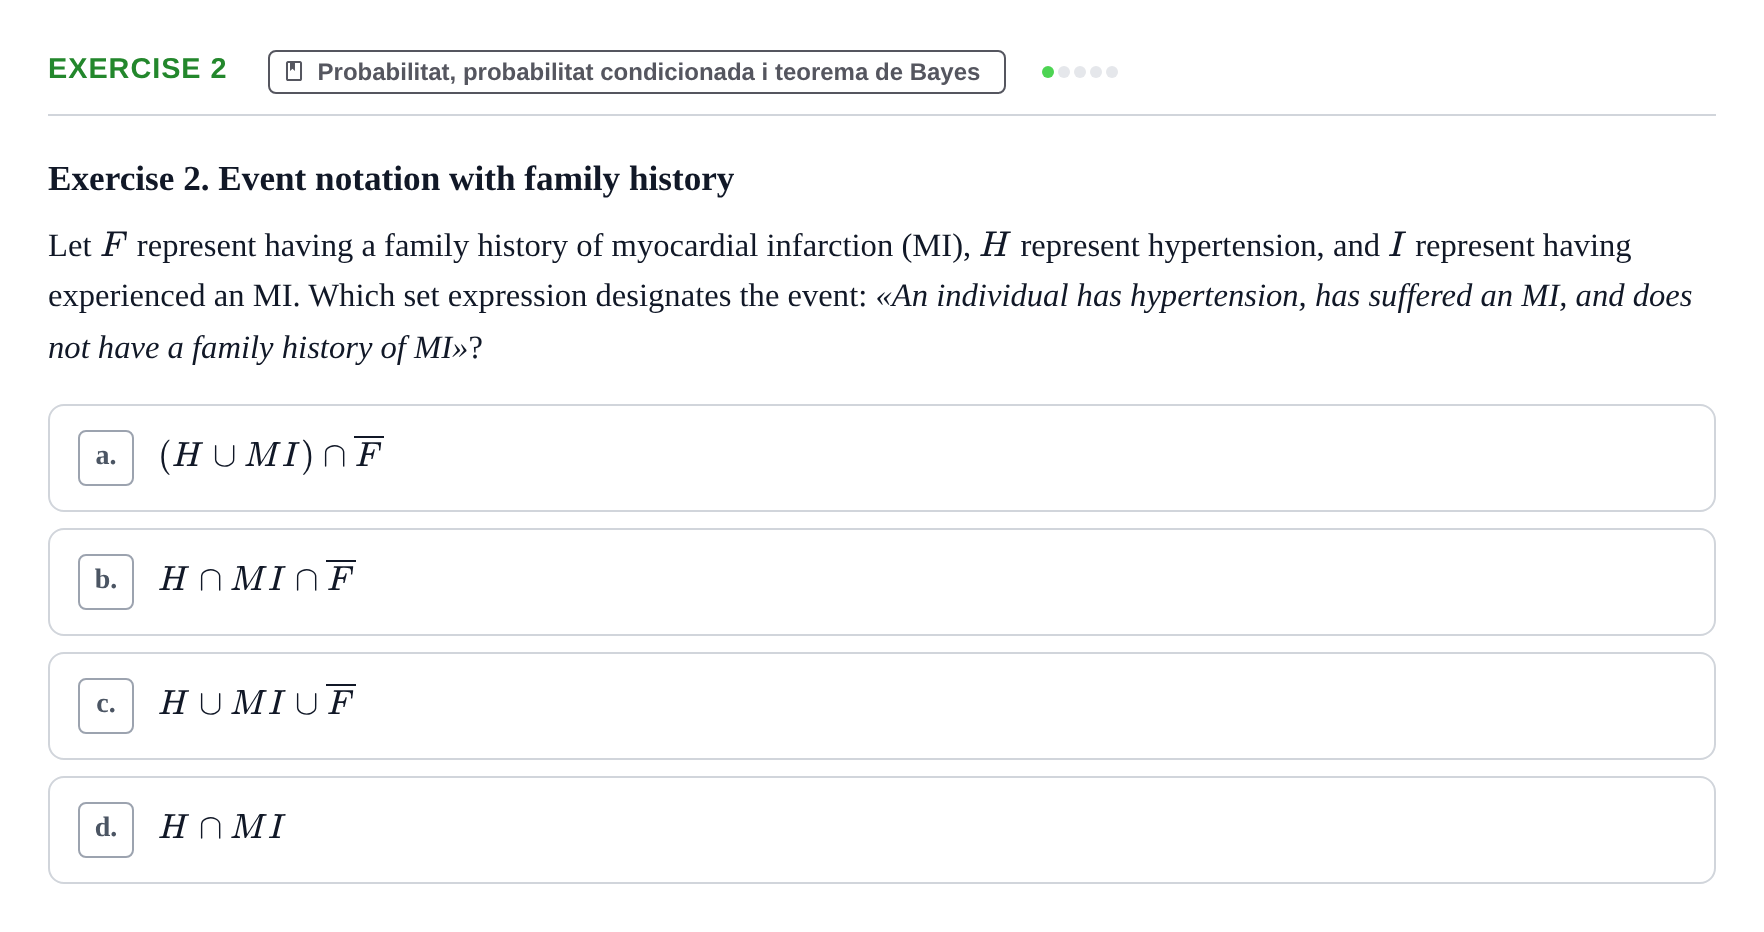
Let represent having a family history of myocardial infarction (MI), represent hypertension, and represent having experienced an MI. Which set expression designates the event: «An individual has hypertension, has suffered an MI, and does not have a family history of MI» ?
.
Exercise 3. Consider three risk factors: hypertension (H), hyperuricemia (U), and hypercholesterolemia (C). Formulate set…
Probabilitat, probabilitat condicionada i teorema de Bayes
Exercise 3. Set operations with cardiovascular risk factors
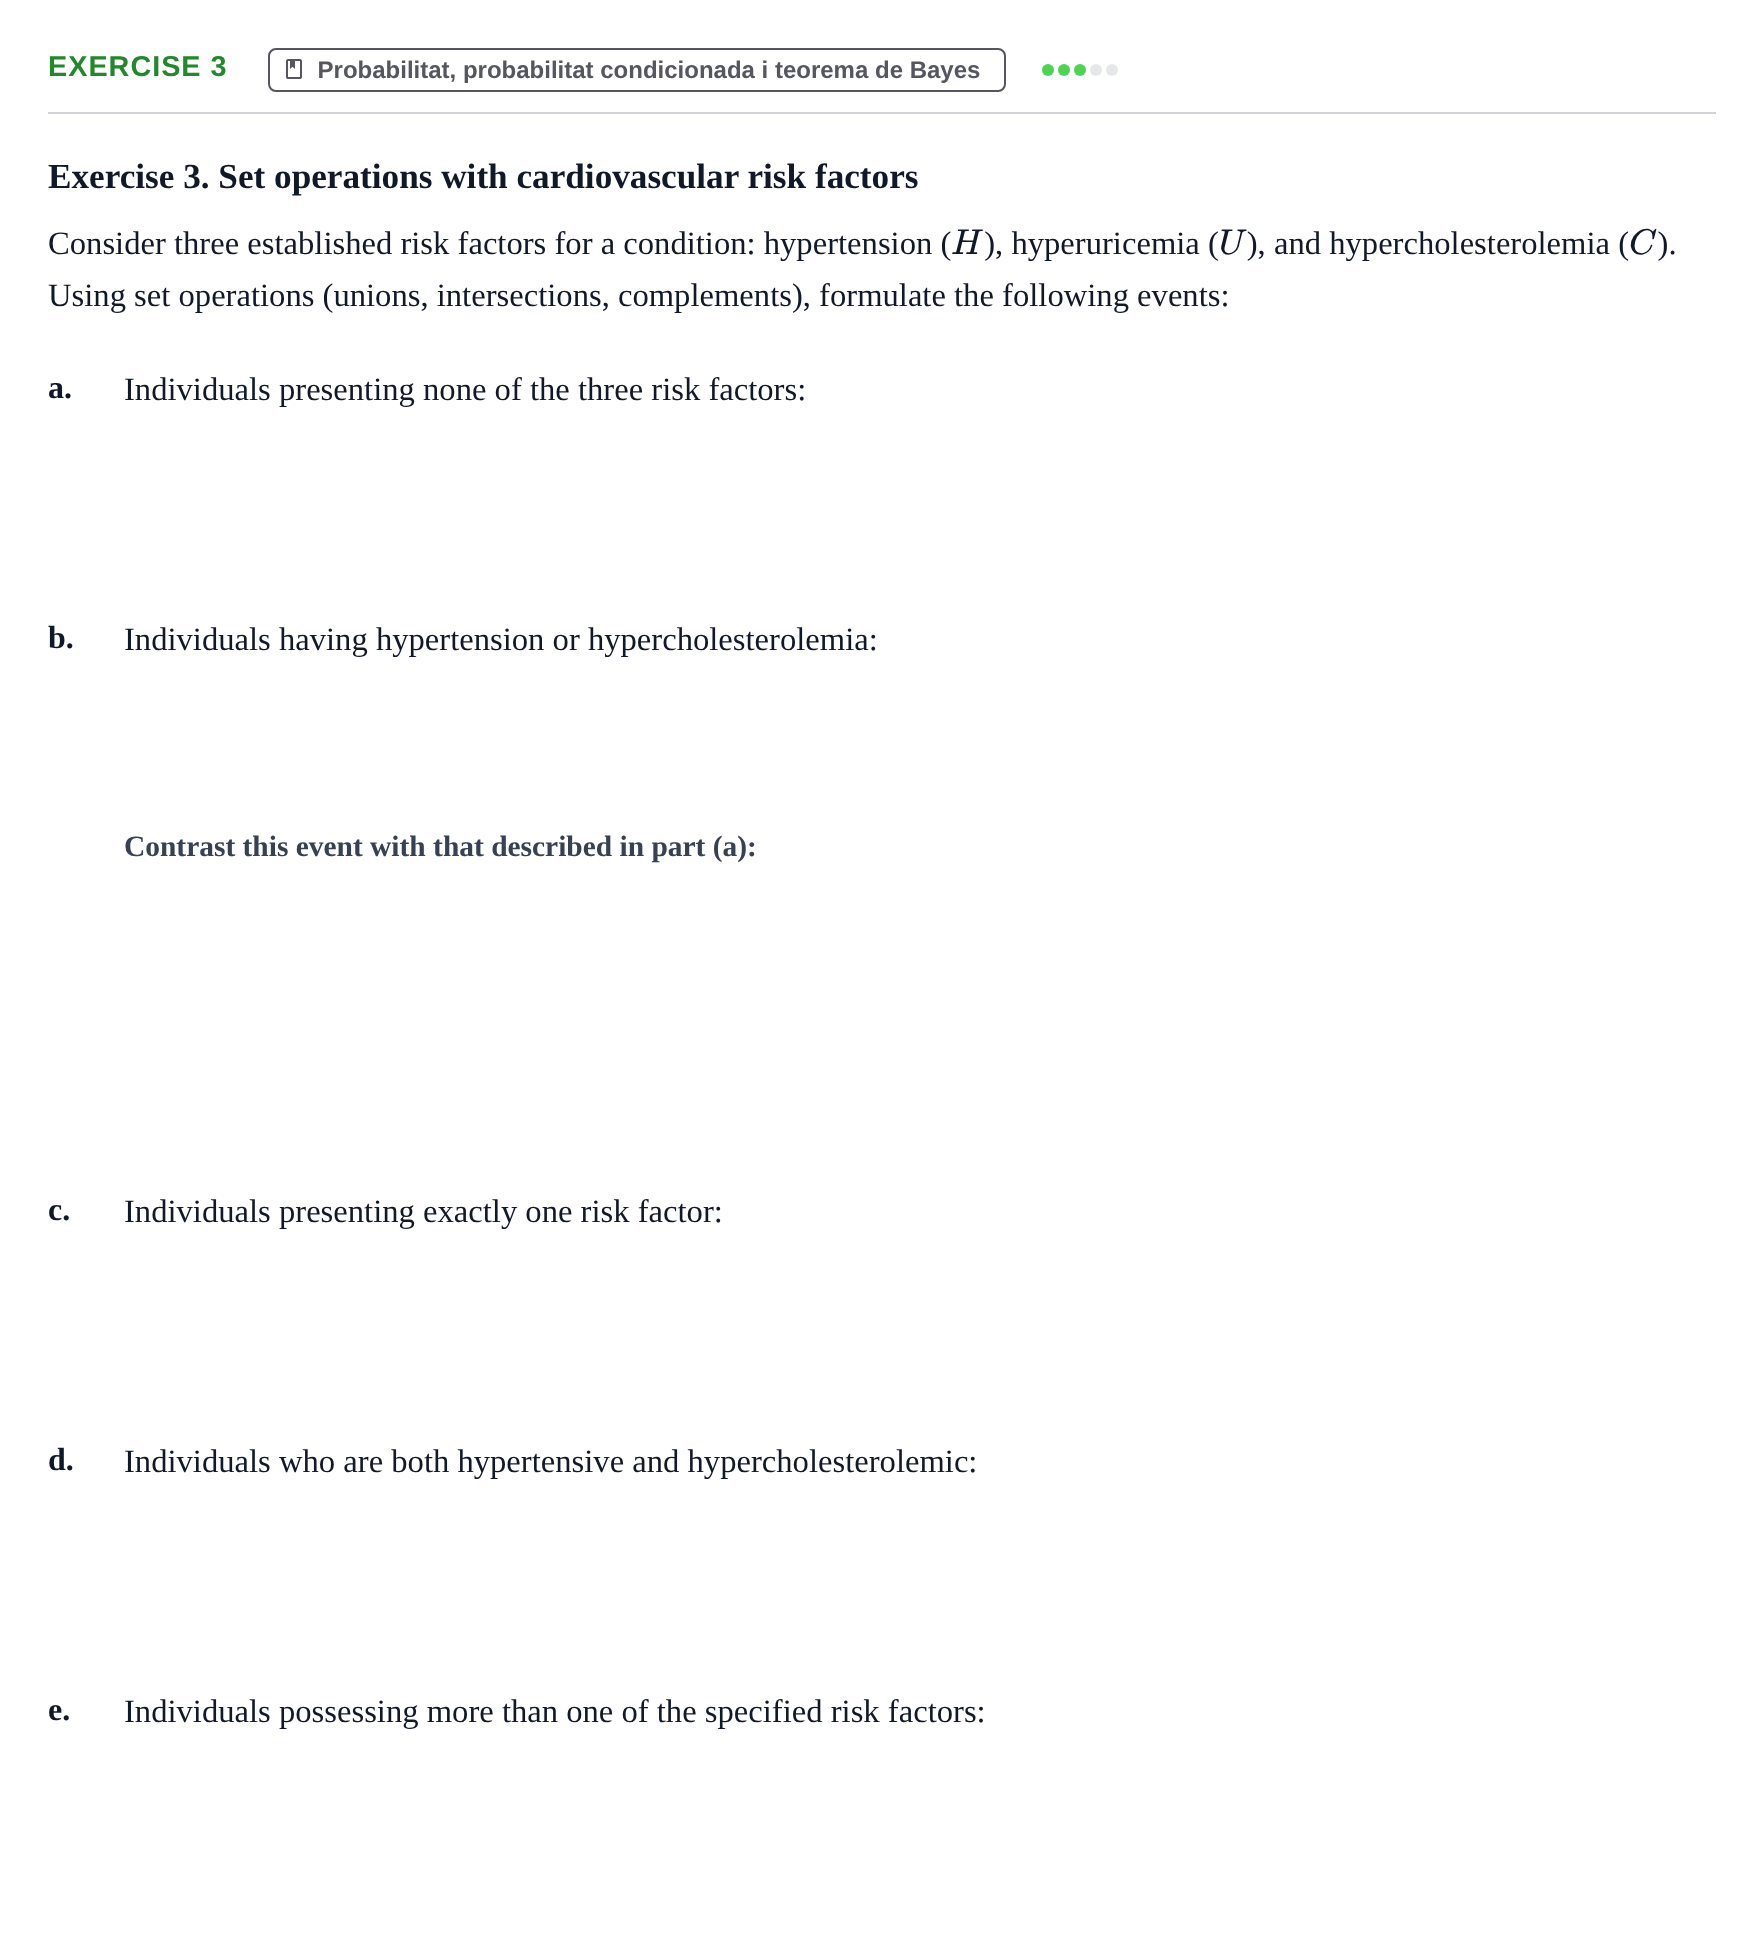
Consider three established risk factors for a condition: hypertension (), hyperuricemia (), and hypercholesterolemia (). Using set operations (unions, intersections, complements), formulate the following events:
a.
Individuals presenting none of the three risk factors:
b.
Individuals having hypertension or hypercholesterolemia:
c.
Individuals presenting exactly one risk factor:
d.
Individuals who are both hypertensive and hypercholesterolemic:
e.
Individuals possessing more than one of the specified risk factors:
Exercise 4. Calculate probabilities of disease combinations (a to j) from a Venn diagram of three diseases A, B, and C.
Probabilitat, probabilitat condicionada i teorema de Bayes
Exercise 4. Probabilities from Venn diagram with three diseases
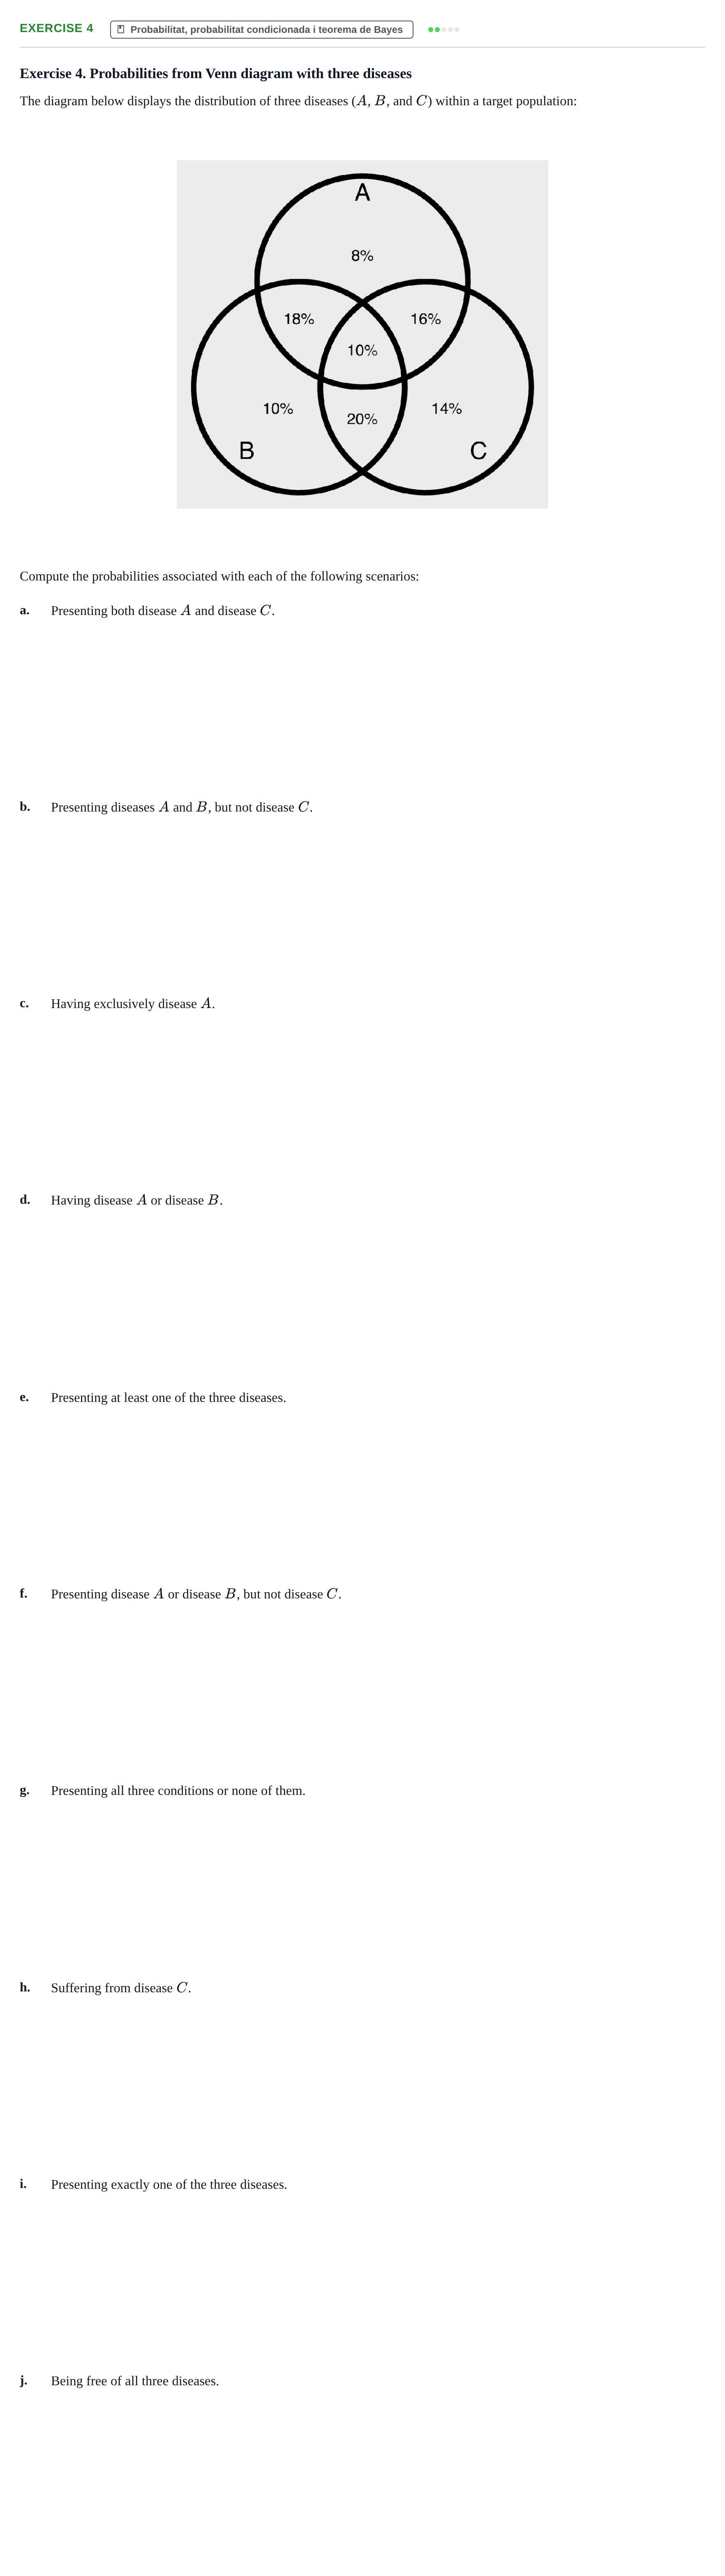
The diagram below displays the distribution of three diseases (, , and ) within a target population:
Compute the probabilities associated with each of the following scenarios:
a.
Presenting both disease and disease .
b.
Presenting diseases and , but not disease .
c.
Having exclusively disease .
d.
Having disease or disease .
e.
Presenting at least one of the three diseases.
f.
Presenting disease or disease , but not disease .
g.
Presenting all three conditions or none of them.
h.
Suffering from disease .
i.
Presenting exactly one of the three diseases.
j.
Being free of all three diseases.
Exercise 5. In an adult cohort, history of three childhood infections (D1, D2, and D3) is distributed as shown in the…
Probabilitat, probabilitat condicionada i teorema de Bayes
Exercise 5. Conditional probabilities of childhood diseases
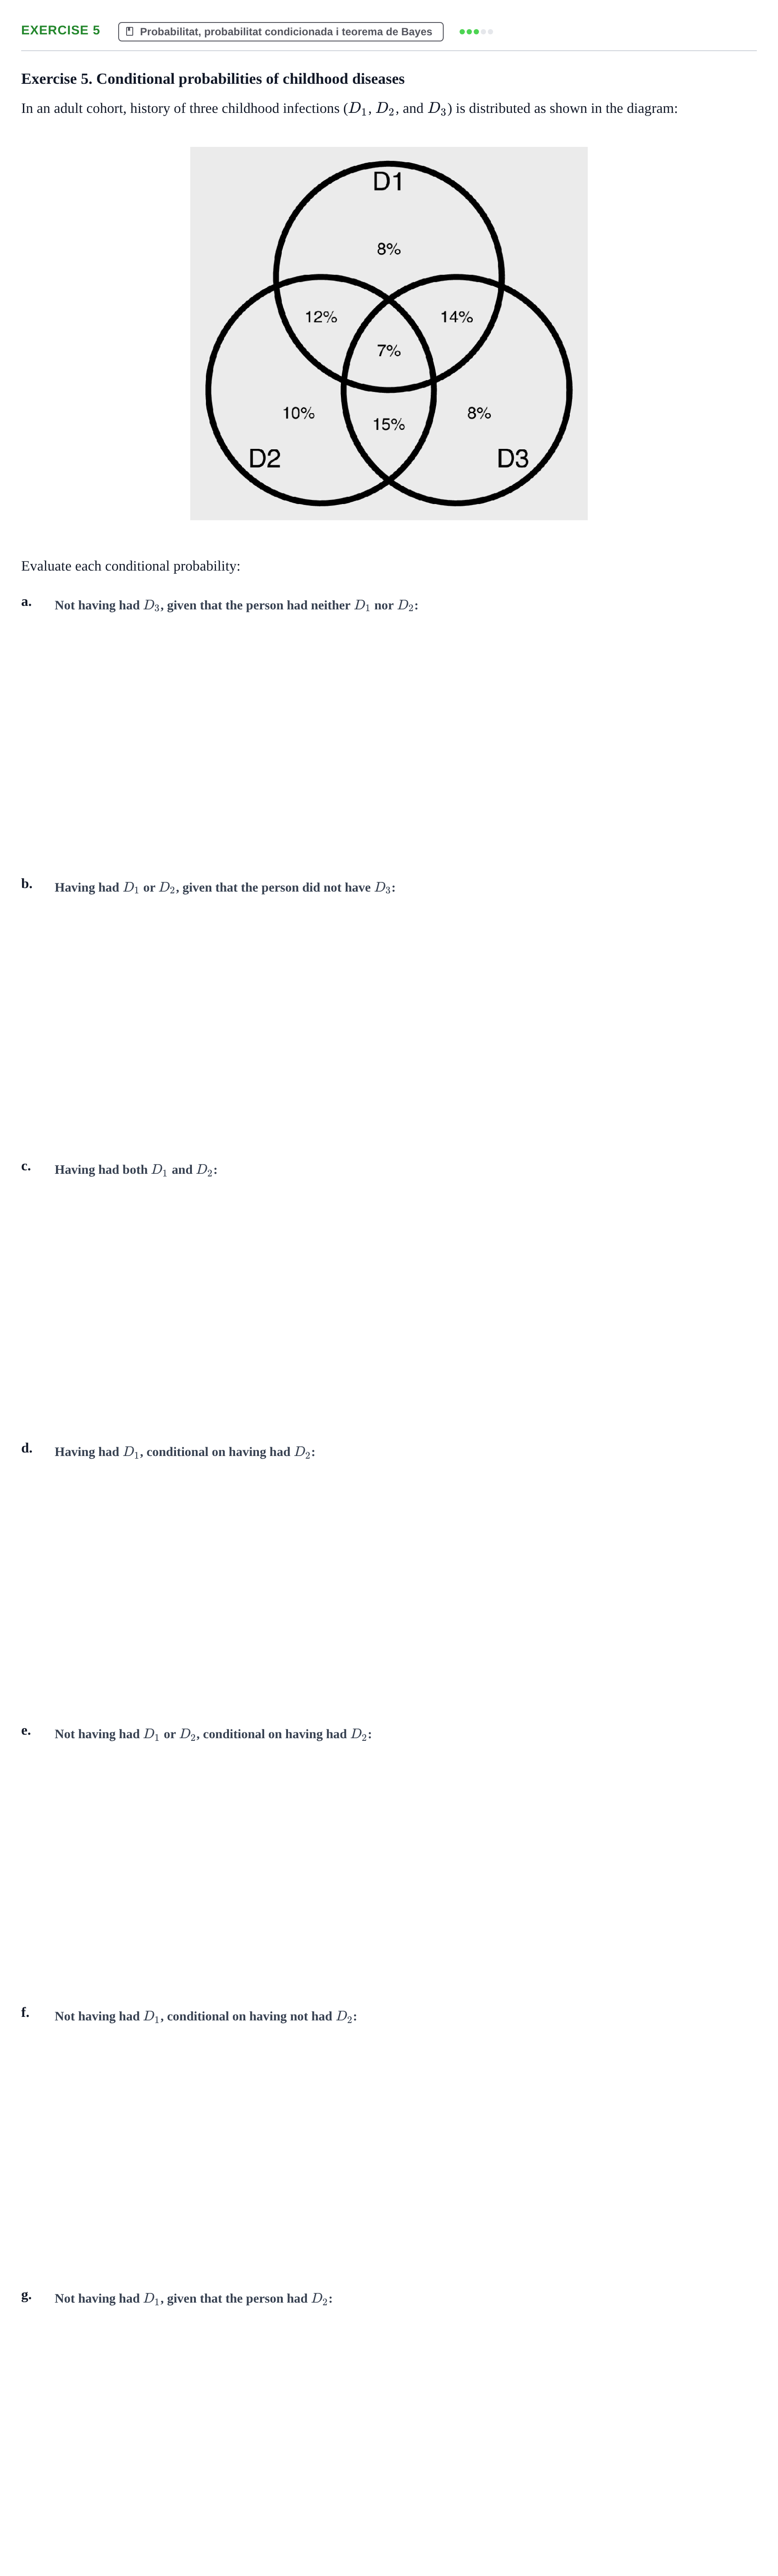
In an adult cohort, history of three childhood infections (, , and ) is distributed as shown in the diagram:
Evaluate each conditional probability:
a.
b.
c.
d.
e.
f.
g.
Exercise 6. A contingency table provides joint probabilities for disease D and risk factor R. Calculate P(D | R), P(D |…
Mesures d'associació: risc relatiu i odds ratio
Exercise 6. Contingency table and relative risk
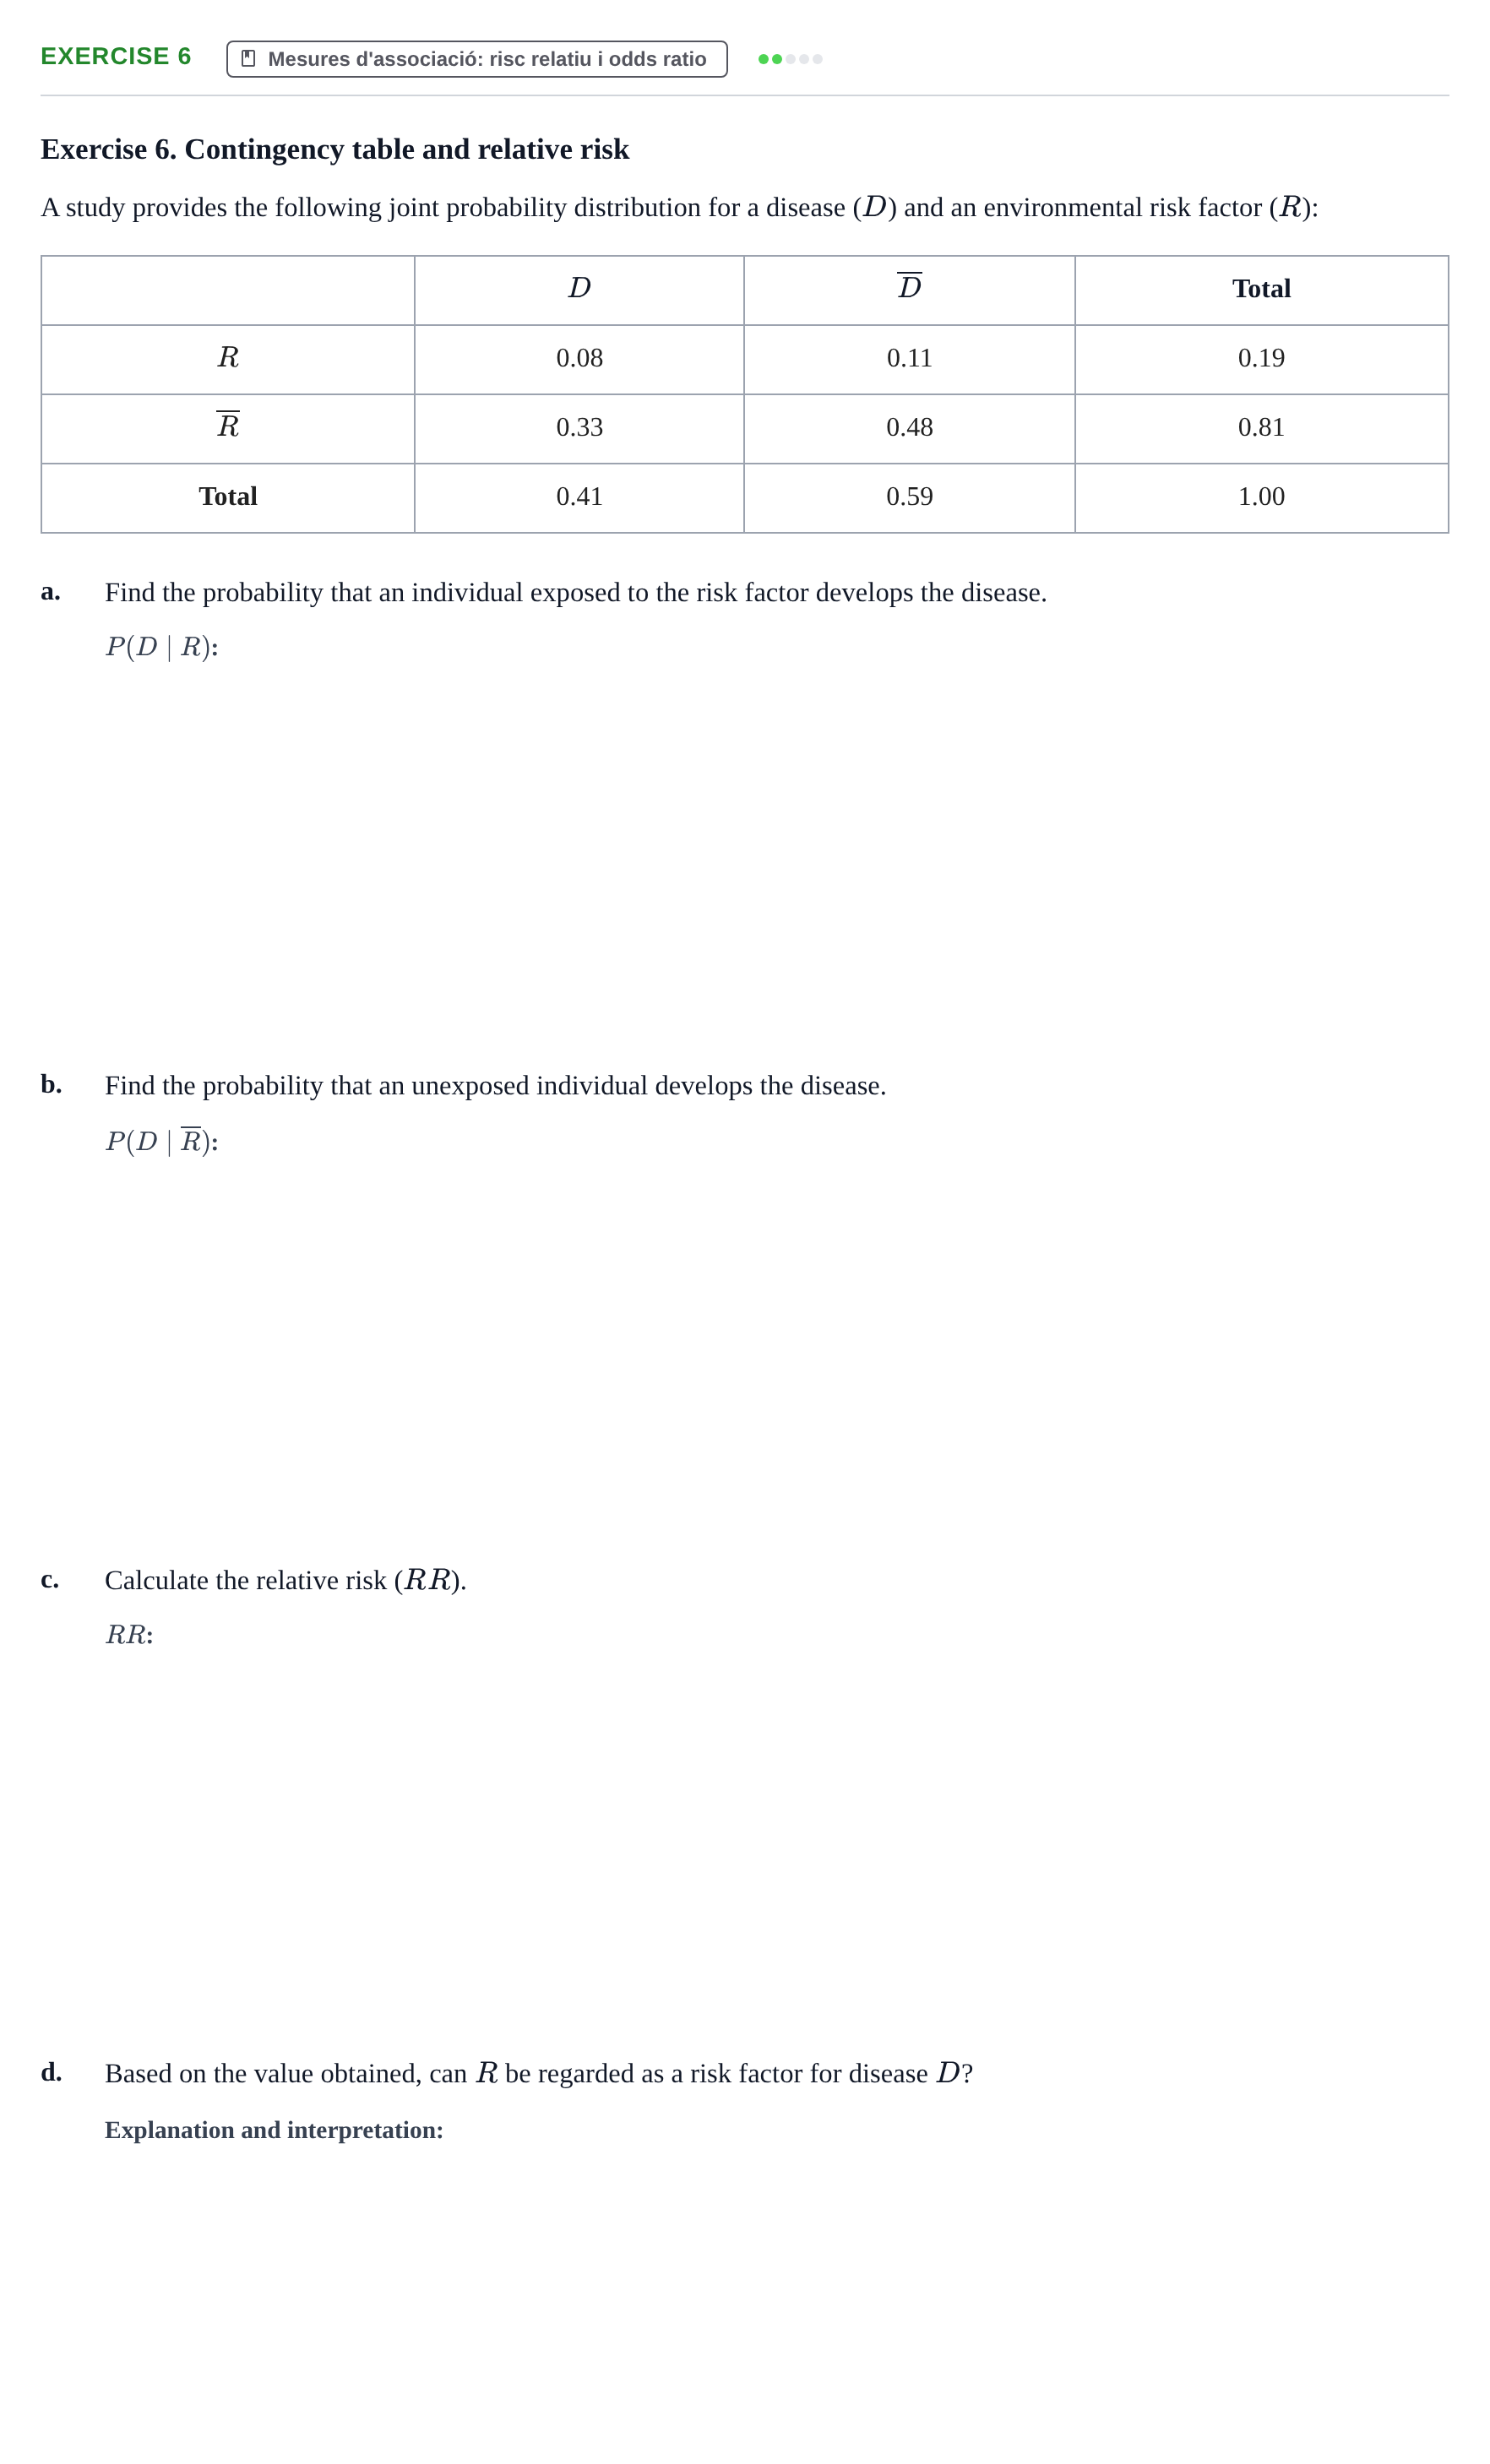
A study provides the following joint probability distribution for a disease () and an environmental risk factor ():
Total
0.08
0.11
0.19
0.33
0.48
0.81
Total
0.41
0.59
1.00
a.
Find the probability that an individual exposed to the risk factor develops the disease.
b.
Find the probability that an unexposed individual develops the disease.
c.
Calculate the relative risk ().
d.
Based on the value obtained, can be regarded as a risk factor for disease ?
Exercise 7. Hospital statistics indicate that 10% of patients diagnosed with a medical condition die within 2 years. In a…
Distribucions discretes: binomial i Poisson
Exercise 7. Hospital mortality and sample space
Hospital statistics indicate that 10% of patients diagnosed with a specific medical condition pass away within a two-year timeframe. Consider a cohort of 5 newly admitted patients with this diagnosis.
a.
Describe the sample space for this group.
b.
c.
Exercise 8. A diagnostic test is evaluated with two cohorts of 522 diseased and 522 healthy individuals. Calculate…
Proves diagnòstiques: sensibilitat, especificitat i valors predictius
Exercise 8. Diagnostic test performance metrics
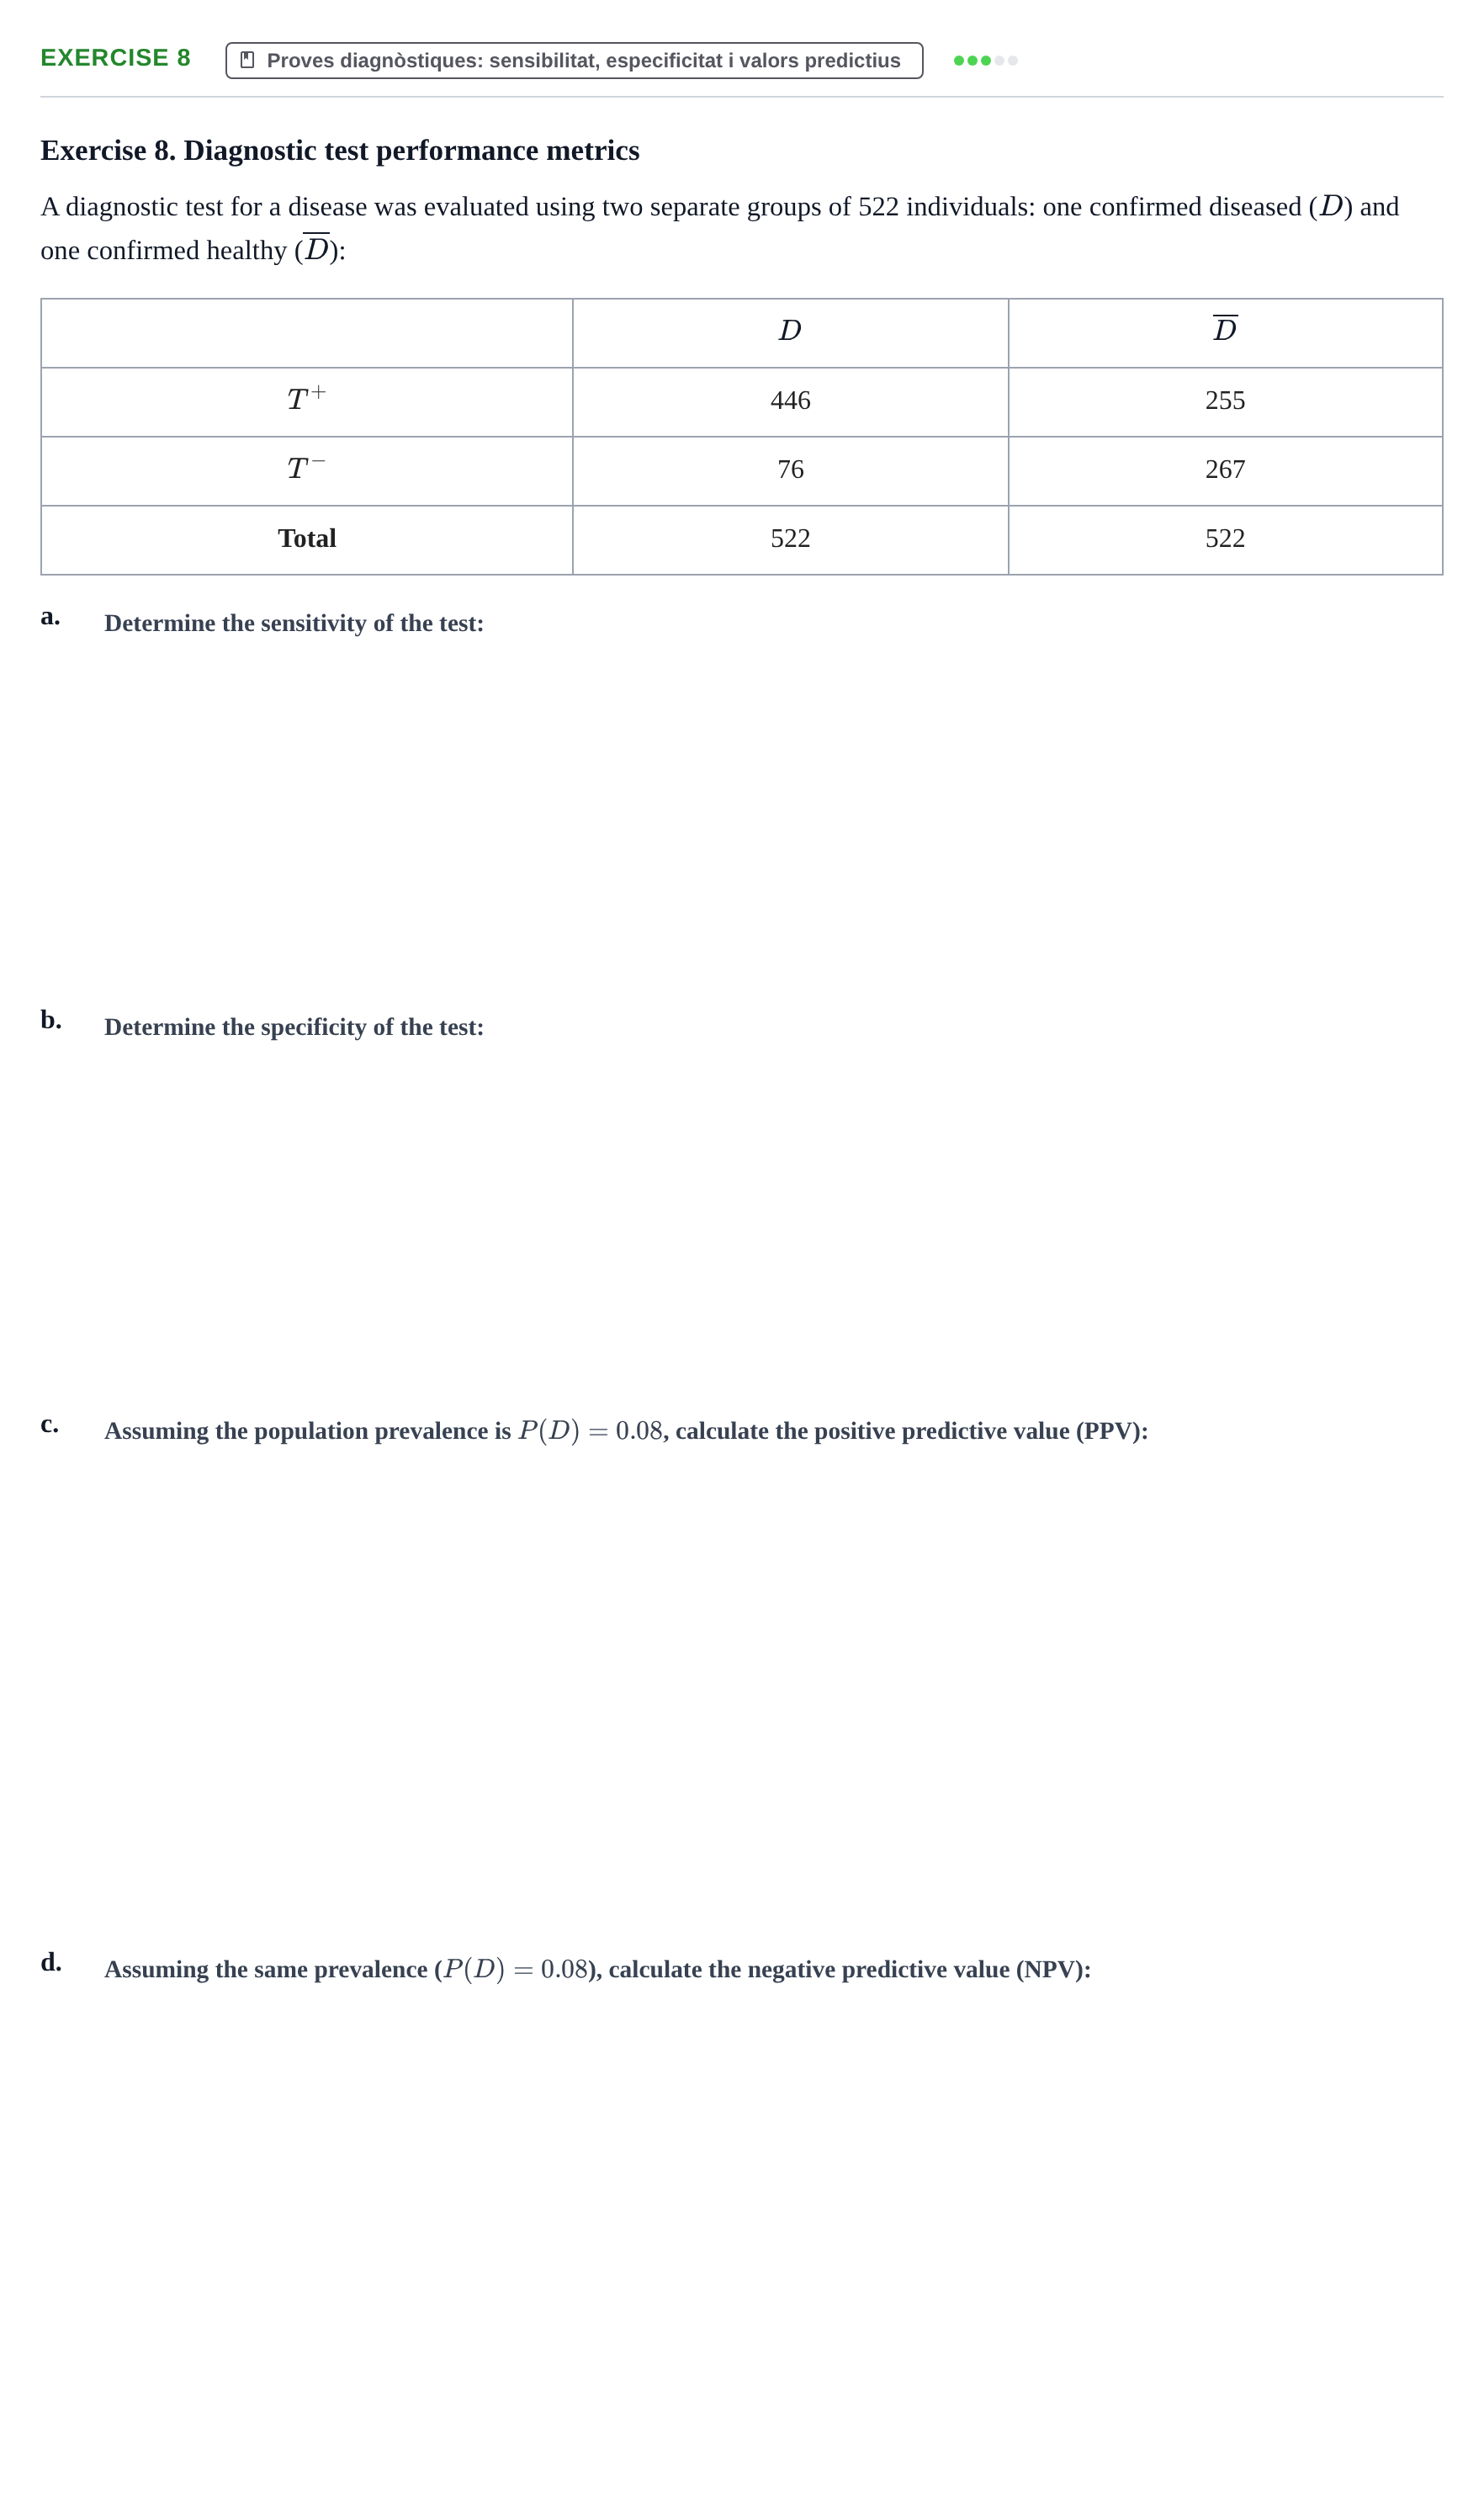
A diagnostic test for a disease was evaluated using two separate groups of 522 individuals: one confirmed diseased () and one confirmed healthy ():
· ·
· 446 · 255
· 76 · 267
Total · 522 · 522
a.
b.
c.
d.
Exercise 9. Given P(B12) = 0.22 and P(folate | B12) = 0.48, calculate the probability of both deficiencies simultaneously…
Probabilitat, probabilitat condicionada i teorema de Bayes
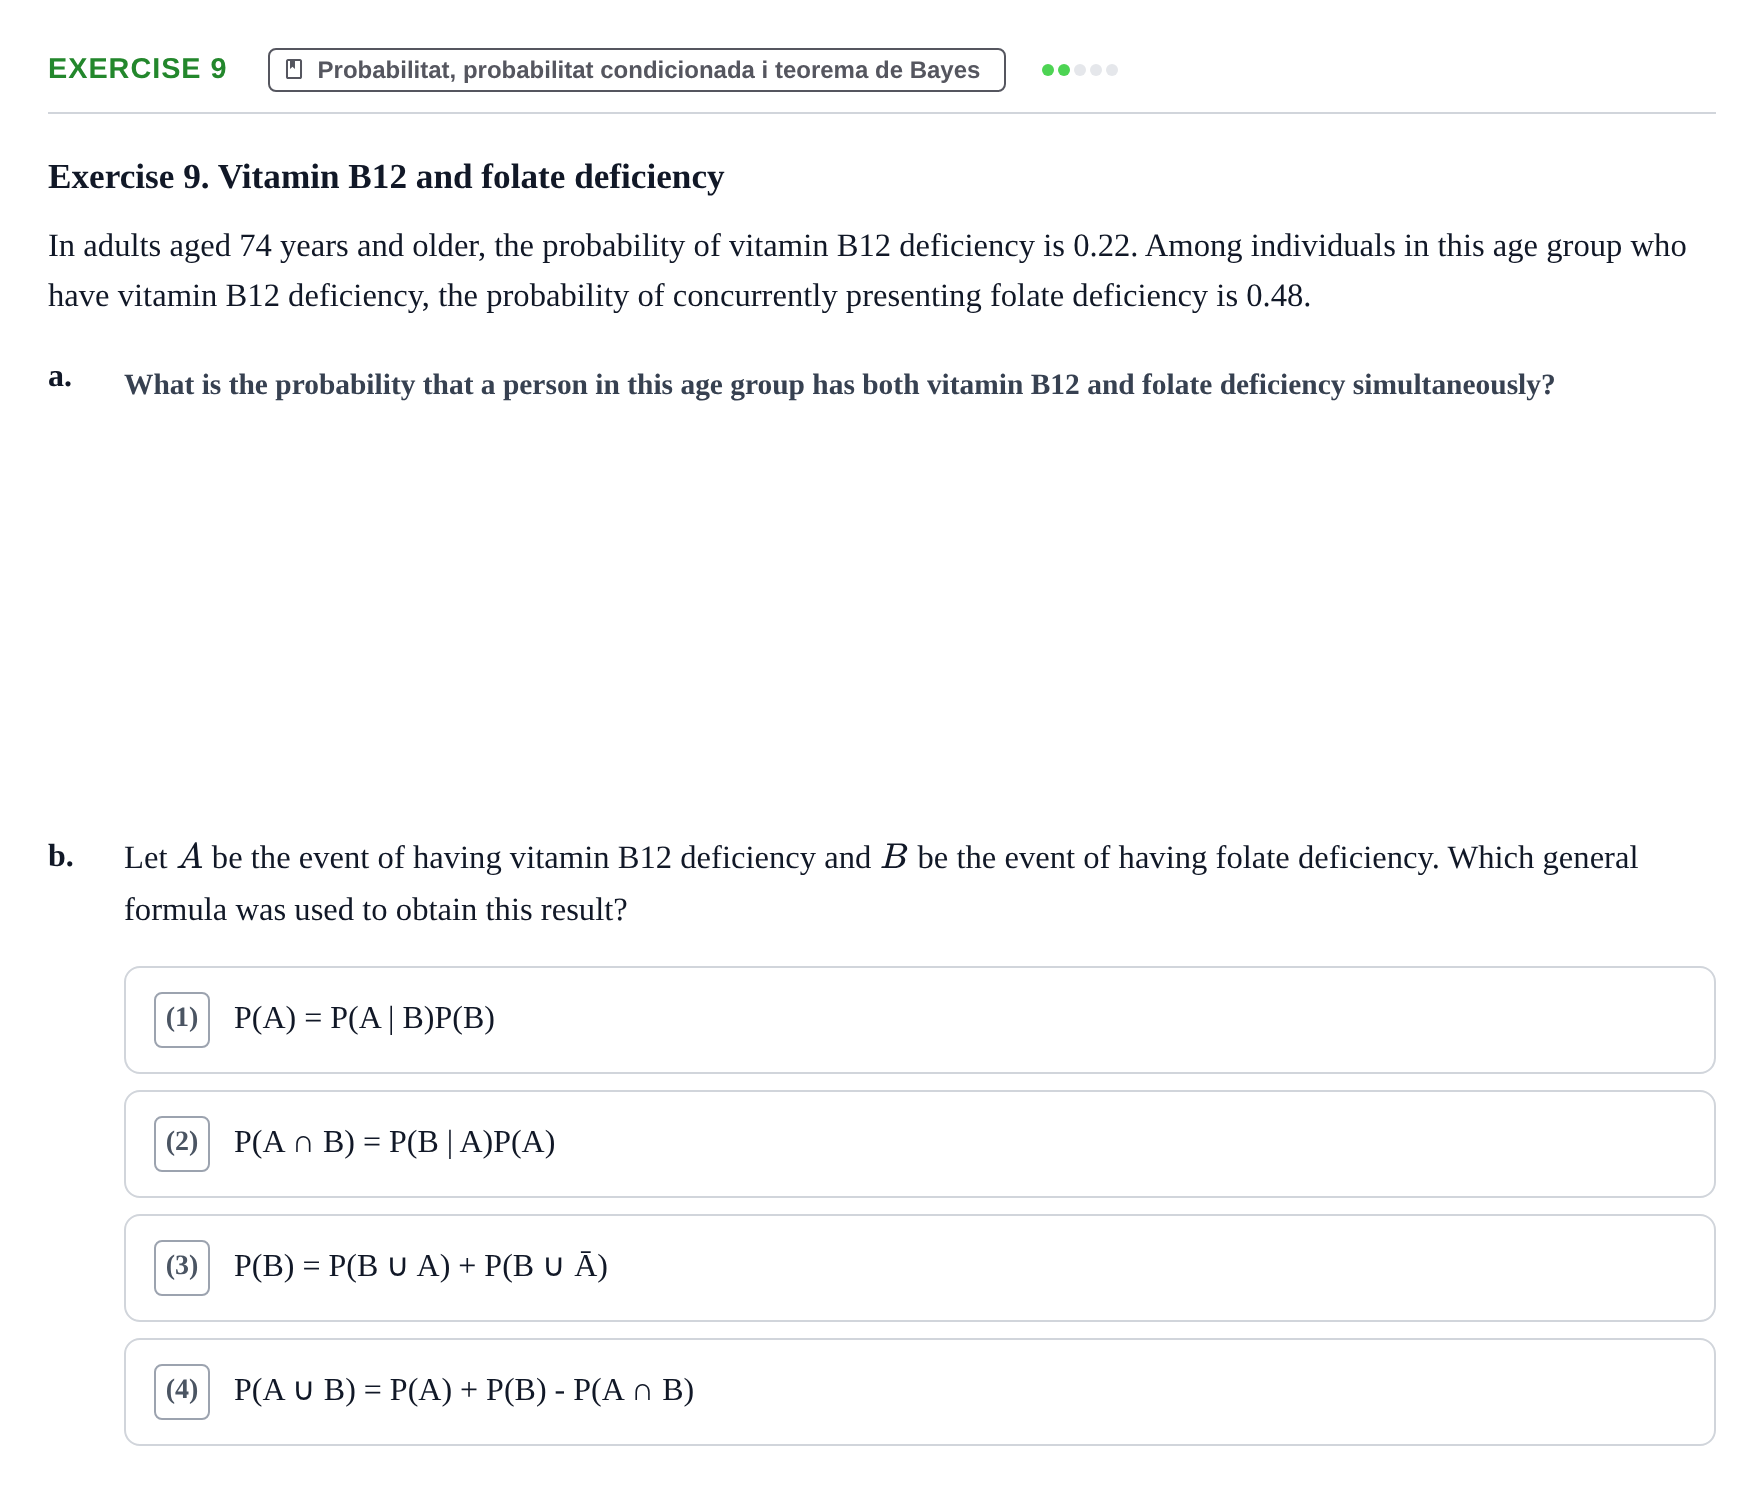
Exercise 9. Vitamin B12 and folate deficiency
In adults aged 74 years and older, the probability of vitamin B12 deficiency is 0.22. Among individuals in this age group who have vitamin B12 deficiency, the probability of concurrently presenting folate deficiency is 0.48.
a.
b.
Let be the event of having vitamin B12 deficiency and be the event of having folate deficiency. Which general formula was used to obtain this result?
()
Exercise 10. In a population, P(A) = 0.11, P(B) = 0.19, and P(A ∩ B) = 0.05. If an individual has risk factor B, what is…
Probabilitat, probabilitat condicionada i teorema de Bayes
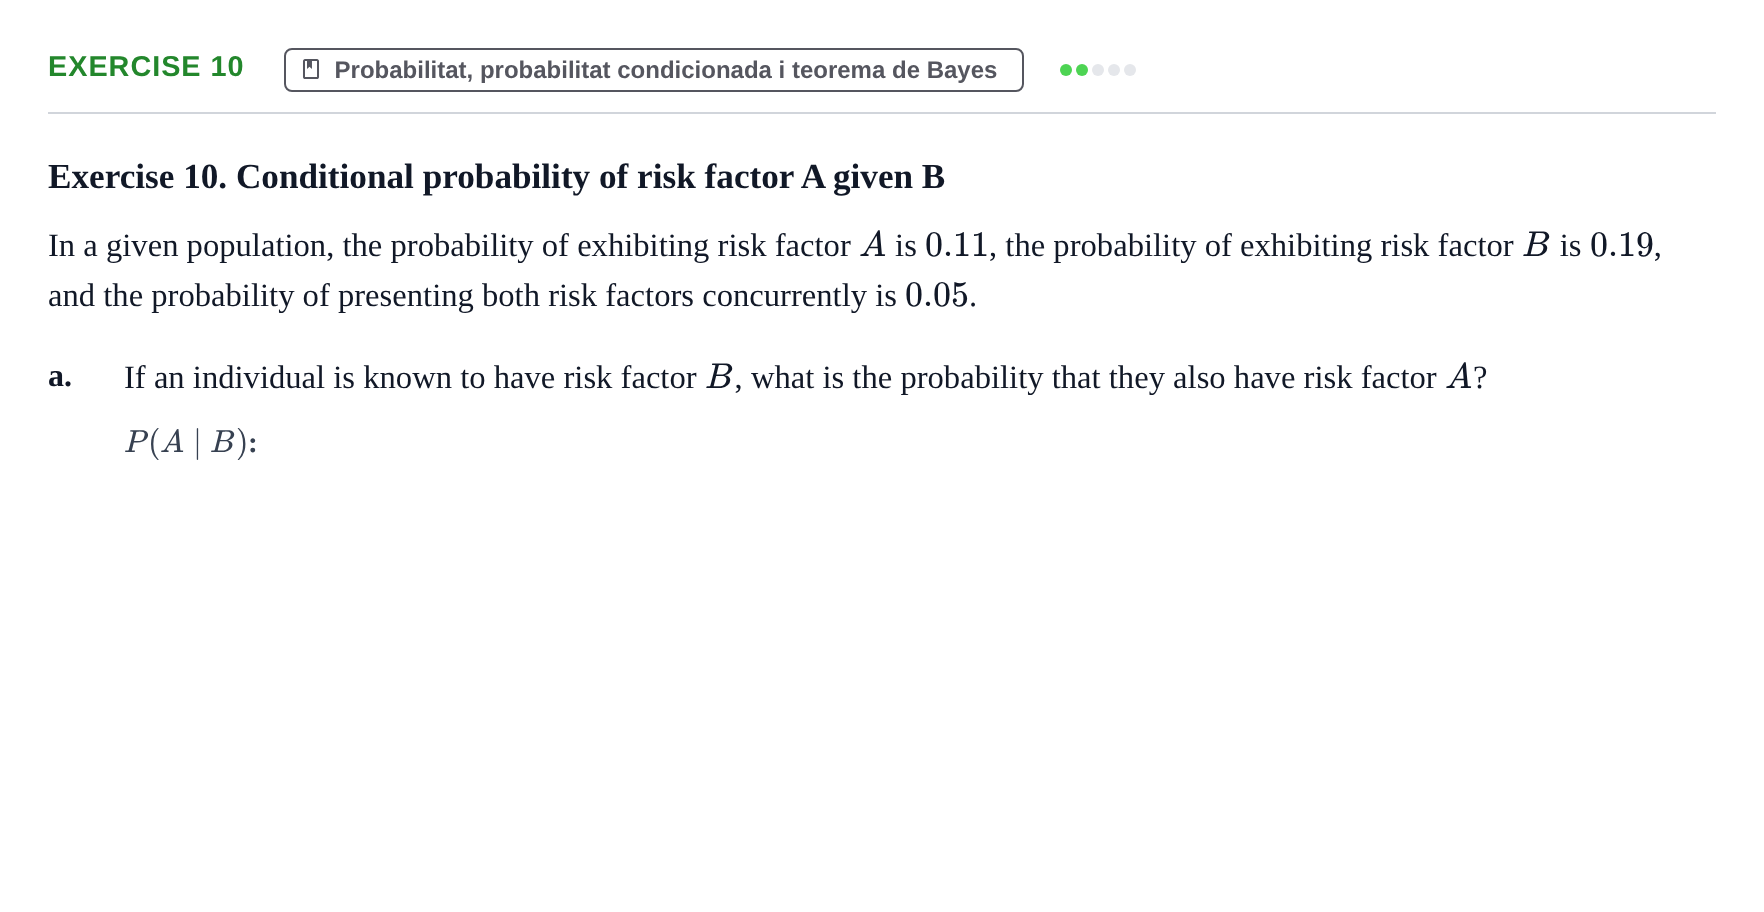
Exercise 10. Conditional probability of risk factor A given B
In a given population, the probability of exhibiting risk factor is , the probability of exhibiting risk factor is , and the probability of presenting both risk factors concurrently is .
a.
If an individual is known to have risk factor , what is the probability that they also have risk factor ?
Exercise 11. Identify the correct definition of the positive predictive value (PPV) of a diagnostic test.
Proves diagnòstiques: sensibilitat, especificitat i valors predictius
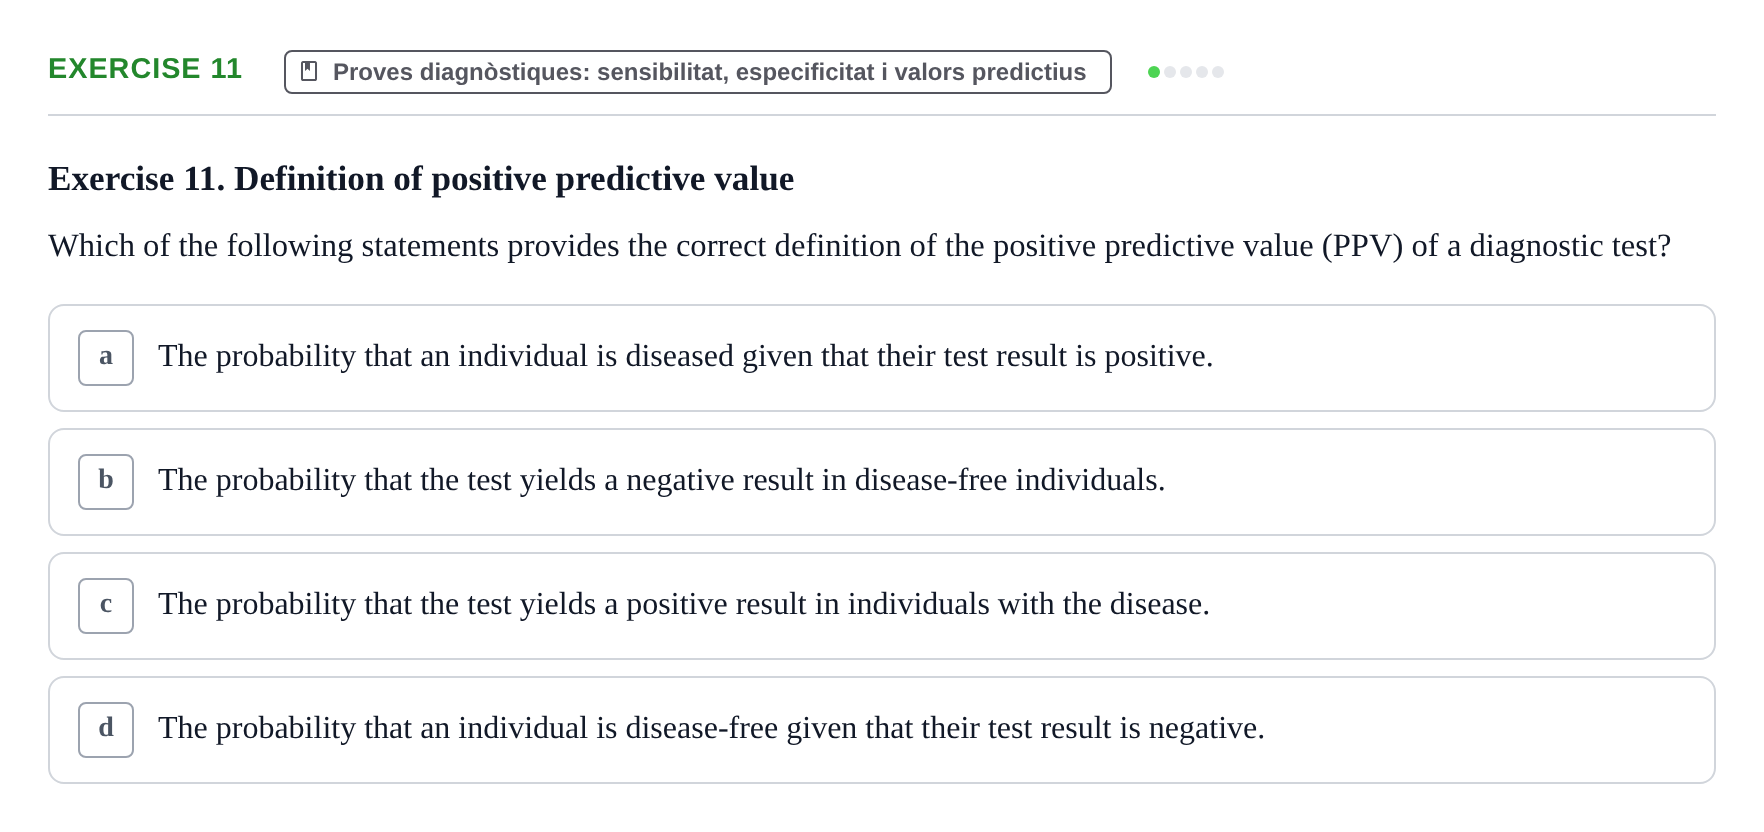
Exercise 11. Definition of positive predictive value
Which of the following statements provides the correct definition of the positive predictive value (PPV) of a diagnostic test?
Exercise 12. Regarding the positive predictive value (PPV) of a diagnostic test, determine which statement is correct.
Proves diagnòstiques: sensibilitat, especificitat i valors predictius
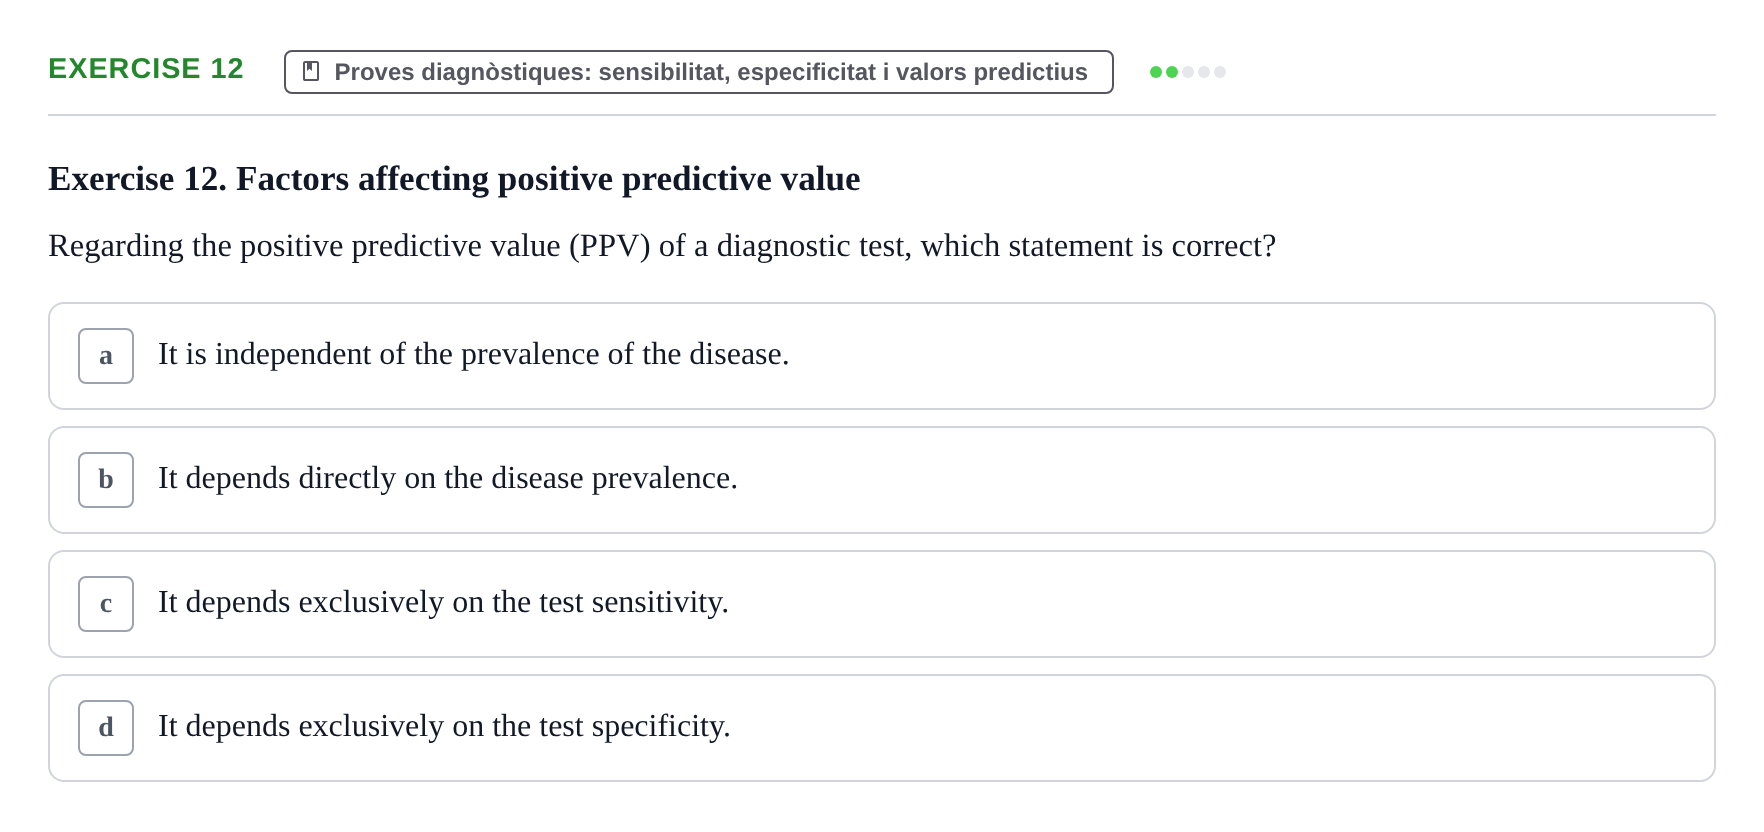
Exercise 12. Factors affecting positive predictive value
Regarding the positive predictive value (PPV) of a diagnostic test, which statement is correct?
Exercise 13. Identify what the negative predictive value (NPV) of a diagnostic test represents.
Proves diagnòstiques: sensibilitat, especificitat i valors predictius
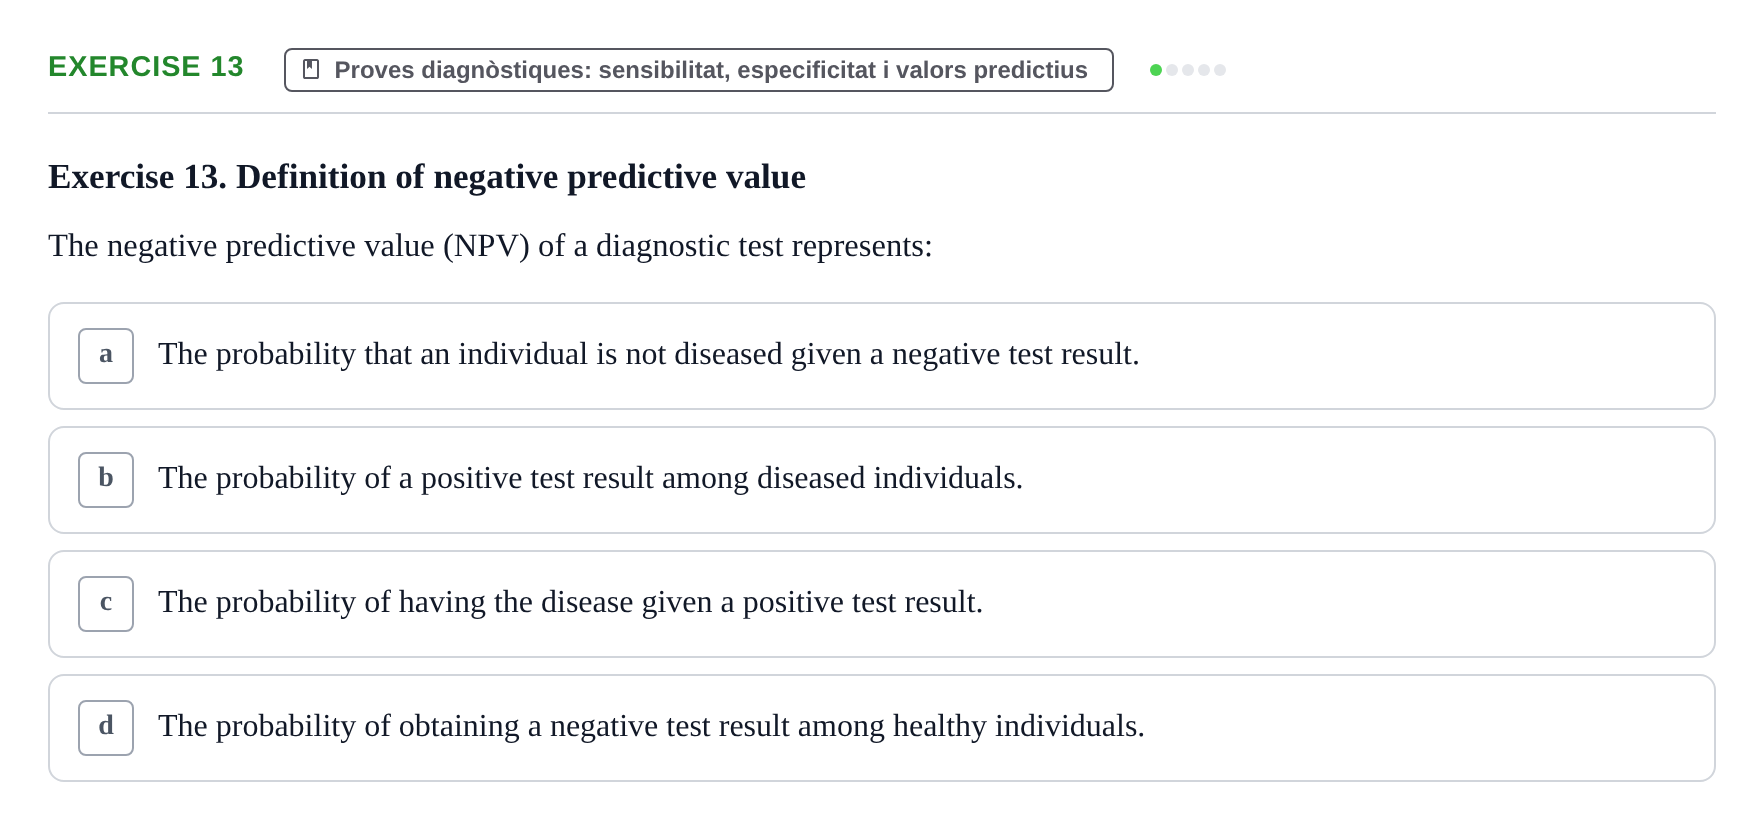
Exercise 13. Definition of negative predictive value
The negative predictive value (NPV) of a diagnostic test represents:
Exercise 14. Identify the correct definition of the sensitivity of a diagnostic test.
Proves diagnòstiques: sensibilitat, especificitat i valors predictius
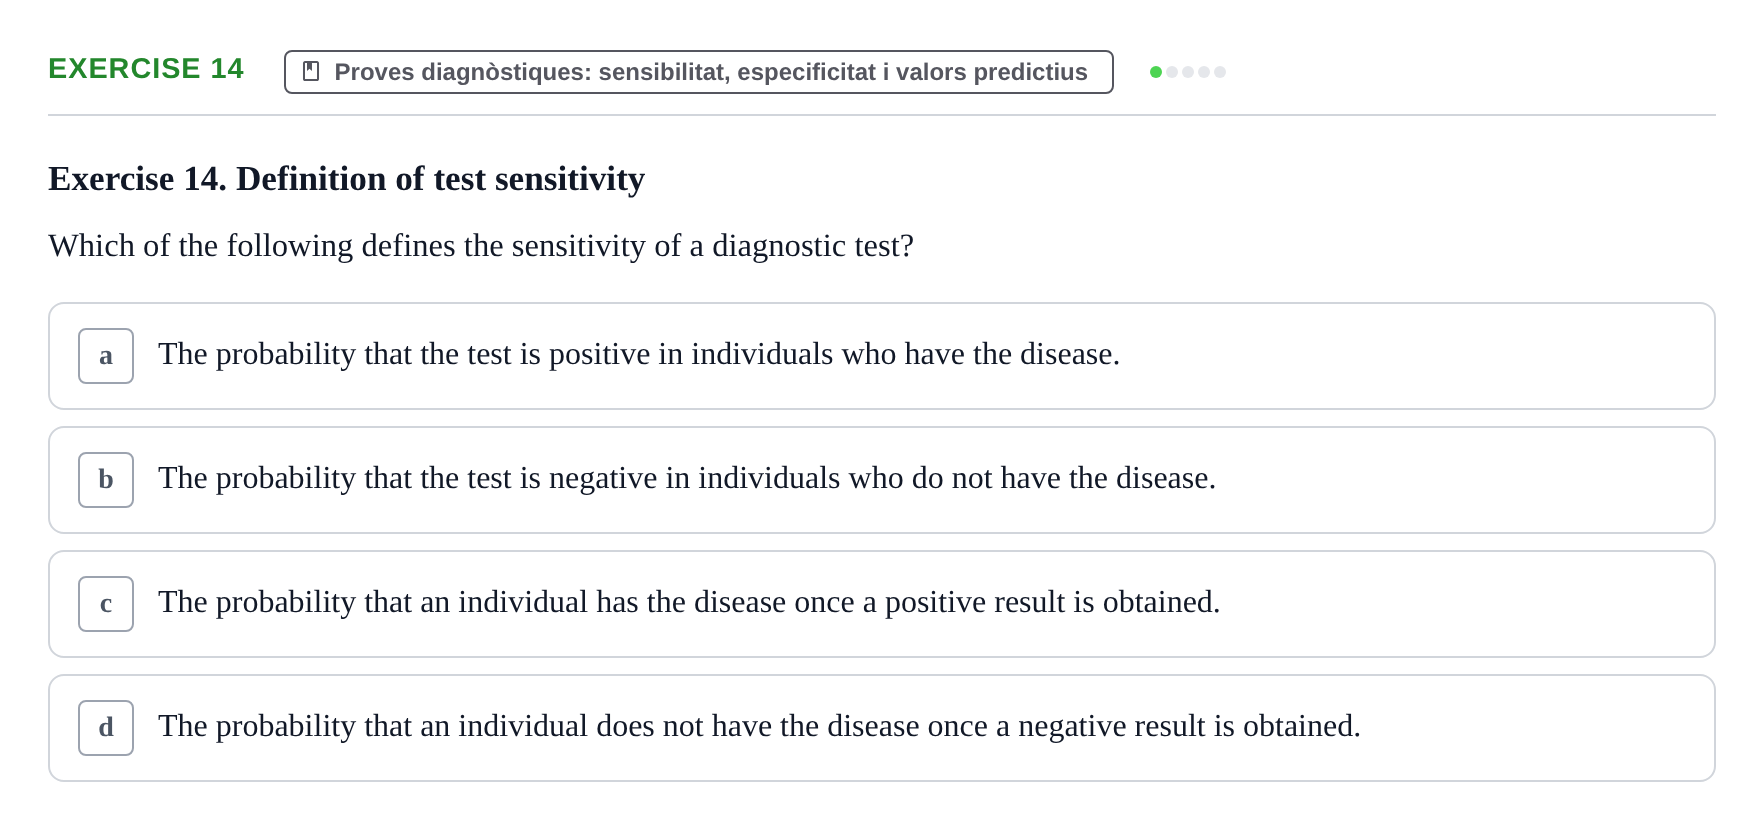
Exercise 14. Definition of test sensitivity
Which of the following defines the sensitivity of a diagnostic test?
Exercise 15. The probability that a person who has the disease receives a negative diagnosis corresponds to: a. 1 -…
Proves diagnòstiques: sensibilitat, especificitat i valors predictius
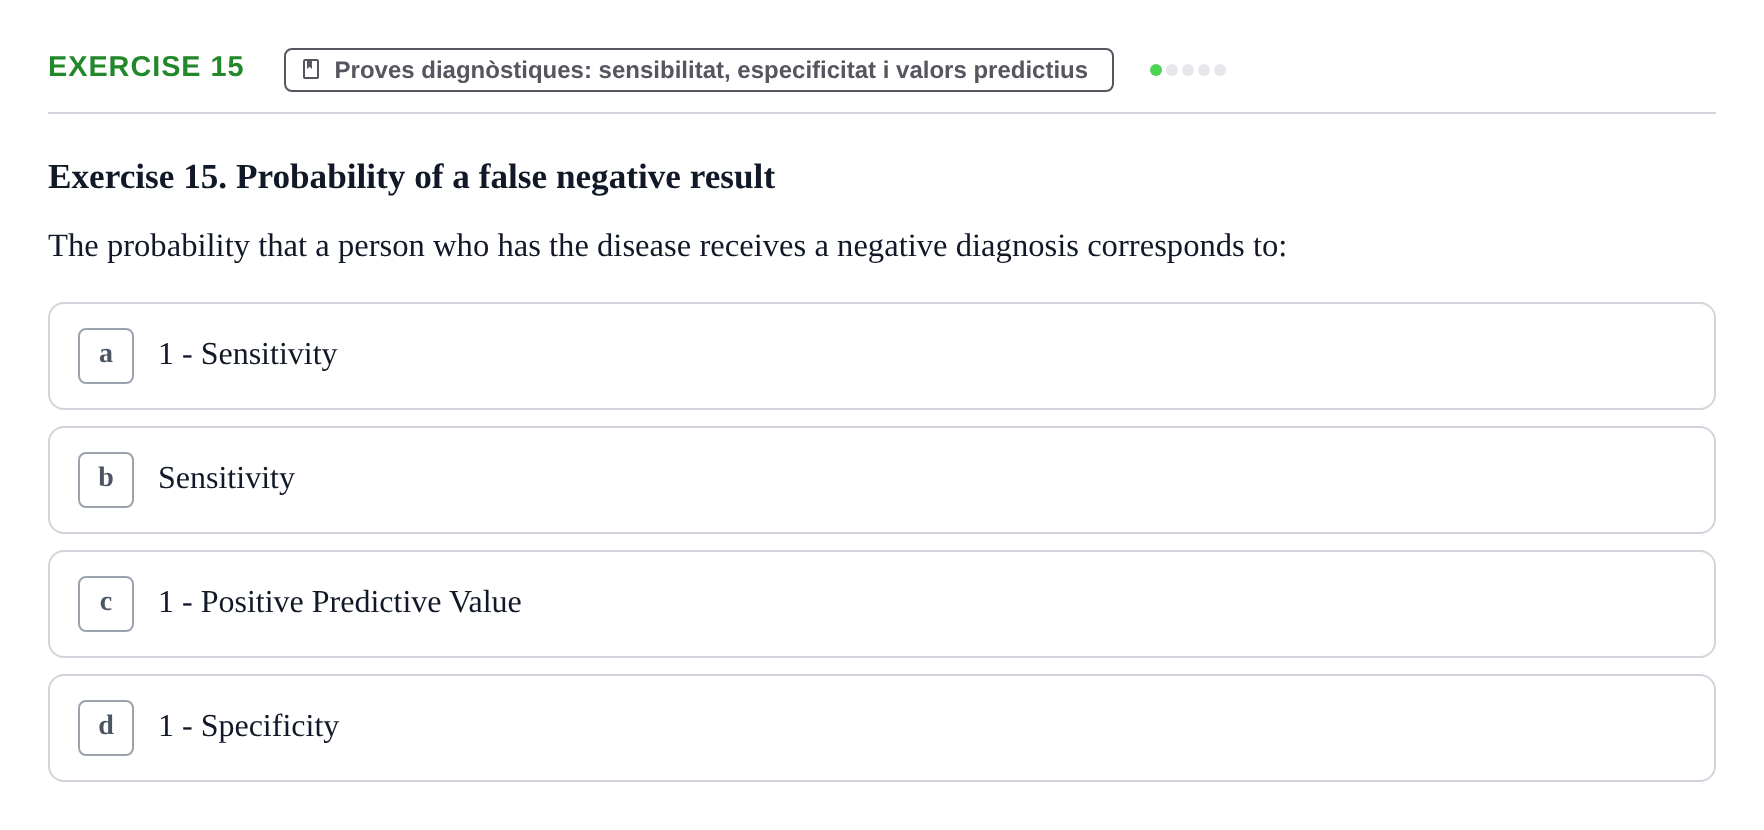
Exercise 15. Probability of a false negative result
The probability that a person who has the disease receives a negative diagnosis corresponds to:
Exercise 16. A diagnostic test is applied to a condition with a prevalence of 11.6%. The false positive rate is 0.18, and…
Proves diagnòstiques: sensibilitat, especificitat i valors predictius
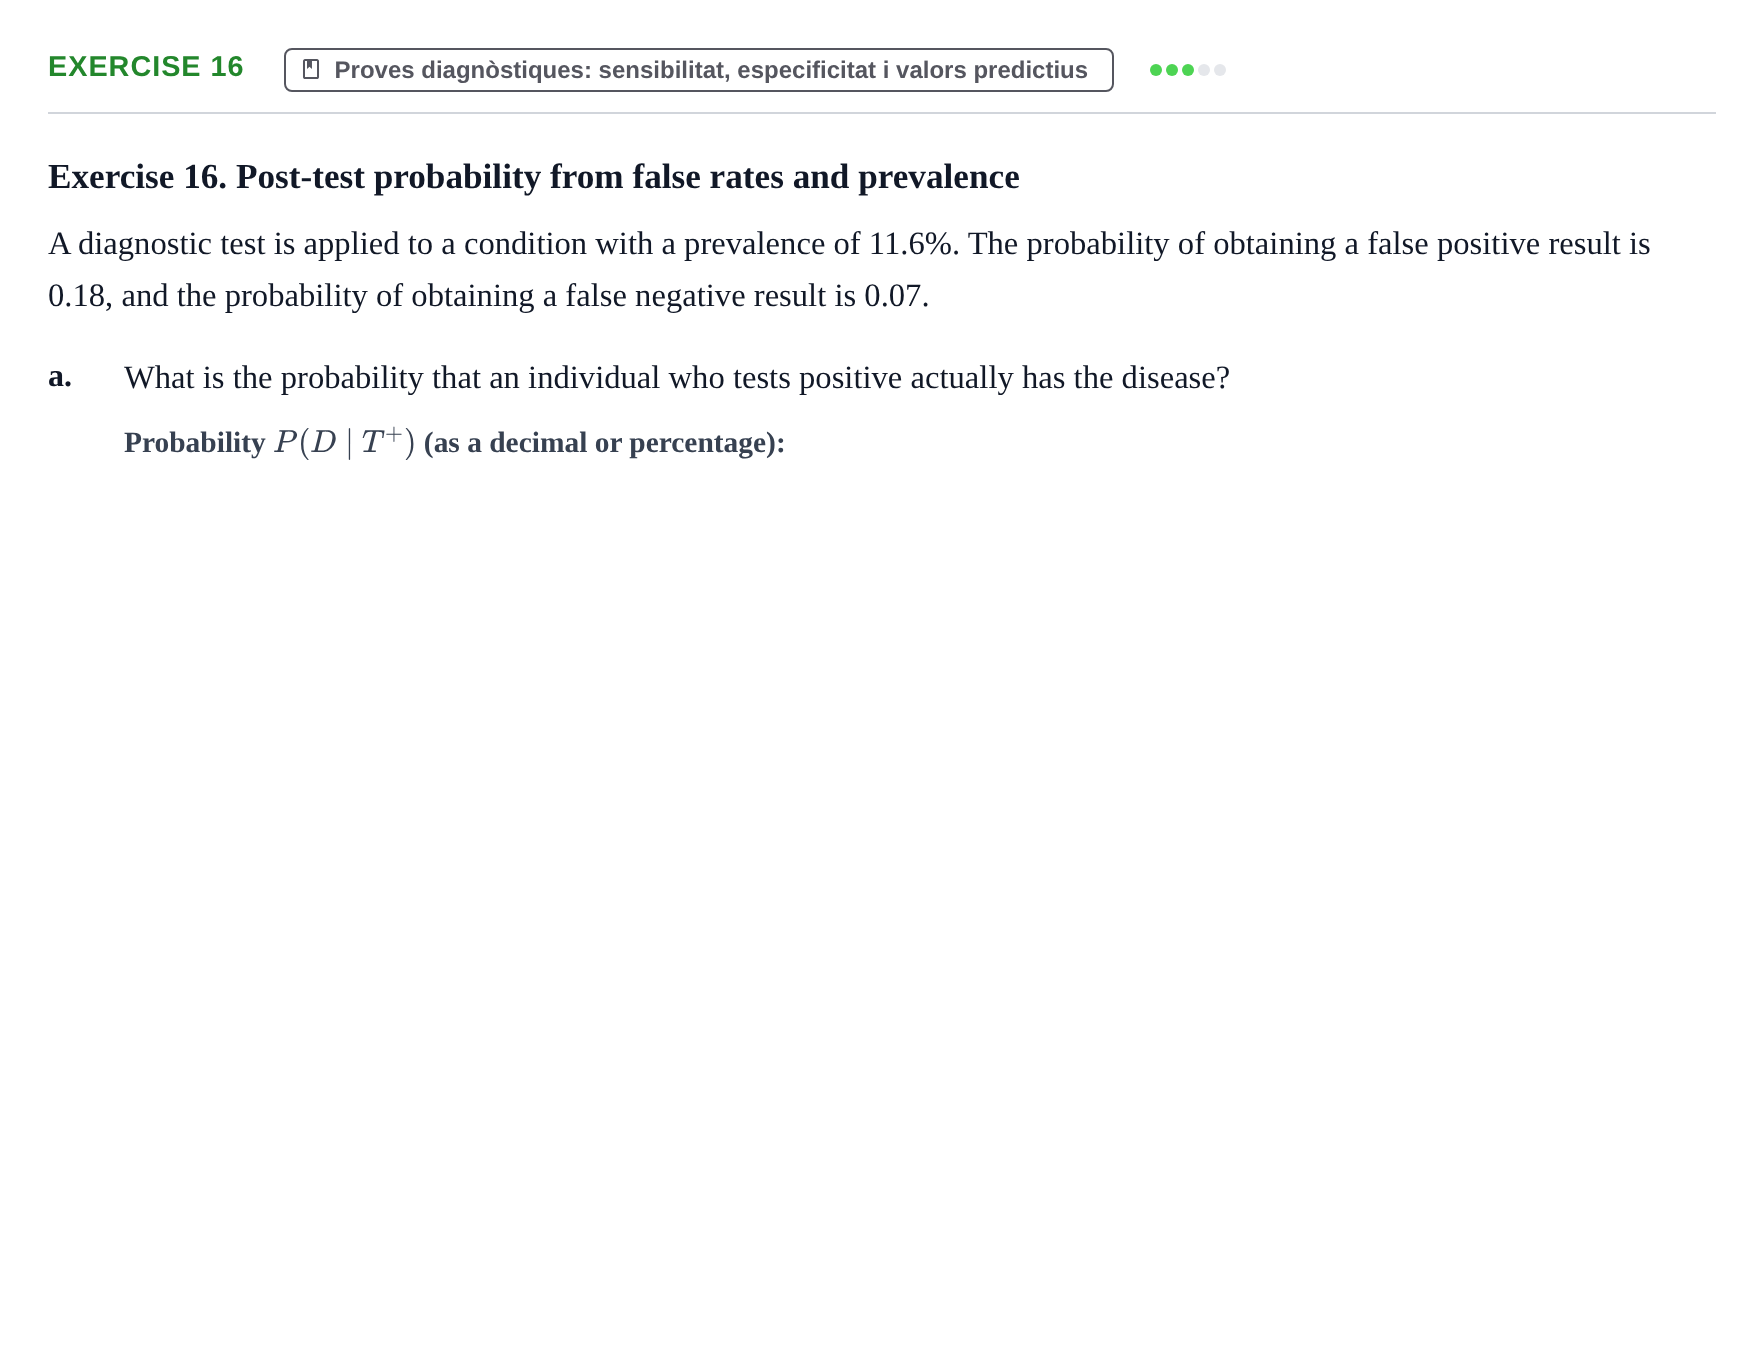
Exercise 16. Post-test probability from false rates and prevalence
A diagnostic test is applied to a condition with a prevalence of 11.6%. The probability of obtaining a false positive result is 0.18, and the probability of obtaining a false negative result is 0.07.
a.
What is the probability that an individual who tests positive actually has the disease?
Exercise 17. A screening procedure has a sensitivity of 0.70 and a specificity of 0.96. a) Calculate LR+. b) Calculate…
Proves diagnòstiques: sensibilitat, especificitat i valors predictius
Exercise 17. Positive and negative likelihood ratios and odds
A screening procedure has a sensitivity of 0.70 and a specificity of 0.96.
a.
Calculate the likelihood ratio for a positive result ().
b.
Calculate the likelihood ratio for a negative result ().
c.
Assuming a disease prevalence of 0.10 and a positive test result, determine the post-test odds of having the disease.
d.
Assuming the same prevalence of 0.10, determine the post-test probability of having the disease following a negative test result.
Exercise 18. Demographic survival data based on life tables for men and women starting with cohorts of 1000 live births.…
Probabilitat, probabilitat condicionada i teorema de Bayes
Exercise 18. Analysis of life tables by sex
The tables below represent demographic survival data based on life tables for men and women, starting with hypothetical cohorts of 1000 live births:
Table 1: Cohort of Men
Age (years)
Surviving
Deaths
Conditional prob. of death
0 · 1000 · 4 · 0.004
10 · 996 · 2 · 0.002
20 · 994 · 4 · 0.004
30 · 990 · 7 · 0.0071
40 · 983 · 19 · 0.0193
50 · 964 · 51 · 0.0529
60 · 913 · 108 · 0.1183
70 · 805 · 220 · 0.2733
80 · 585 · 375 · 0.641
90+ · 210 · 210 · 1
Table 2: Cohort of Women
Age (years)
Surviving
Deaths
Conditional prob. of death
0 · 1000 · 3 · 0.003
10 · 997 · 2 · 0.002
20 · 995 · 2 · 0.002
30 · 993 · 3 · 0.003
40 · 990 · 11 · 0.0111
50 · 979 · 23 · 0.0235
60 · 956 · 46 · 0.0481
70 · 910 · 129 · 0.1418
80 · 781 · 383 · 0.4904
90+ · 398 · 398 · 1
a.
What general trends do these tables display, and what primary differences emerge between men and women?
b.
What is the probability that a newborn survives to age 20?
c.
What is the probability that an individual dies before reaching age 20? Which probability axiom/property does this calculation rely on?
d.
Assuming an individual has attained age 20, what is the probability that they will survive to age 40?
e.
Assuming an individual has attained age 20, what is the probability that they will survive to age 60?
f.
Assuming two friends of the same sex are currently 20 years old, what is the probability that both survive to age 60?
g.
Out of 100 students aged 20 of a given sex, how many would be expected to reach age 80? What primary factors influence mortality rates?
h.
What is the probability that a 20-year-old individual dies during their third decade of life (between age 20 and 30)?
i.
How is the probability of dying in each decade computed for a cohort, and what is this distribution termed?
